
Schedule of Cost (SOC)
Track project costs across four stages — Estimated, Budgeted, Contracted, and Actual — with live variance monitoring against your Schedule of Values.
What Is the Schedule of Costs?
The Schedule of Costs (SOC) is a four-stage cost lifecycle tool used by the General Contractor to plan, track, and control project costs from early estimation all the way through to live actuals derived from the Schedule of Values.
The module surfaces a single, consolidated view of every cost line — Division, Subdivision, and Task — across all four stages simultaneously, so the team can spot overruns before they become problems.
"Promote tasks Estimated → Budgeted → Contracted → Actual. The Actual stage is computed live from approved Schedule of Values."
Why the Schedule of Costs Matters
- End-to-end cost visibility — see all four cost stages for every line item on one screen
- Early overrun detection — the module flags any contracted cost that meets or exceeds its budget, so you can catch overruns before work begins
- Live actuals — the Actual column is computed in real time from approved Schedule of Values entries
- Forecasted Profit — each row shows a running profit forecast so the team knows where margin is being lost
- Audit trail — each stage is frozen with a date when promoted, creating an immutable history
The Four Cost Stages
The SOC is built around a linear promotion flow. Each stage is locked ("frozen") once promoted to the next:
| Stage | Source | When Frozen |
|---|---|---|
| Estimated | PM / Superintendent — initial pre-billing estimate | When promoted to Budgeted |
| Budgeted | Promoted from Estimated — becomes the official budget baseline | When promoted to Contracted |
| Contracted | Pulled from linked Schedule of Values (SOV) | When SOV is approved |
| Actual | Computed live from approved SOVs | Always live — never frozen |
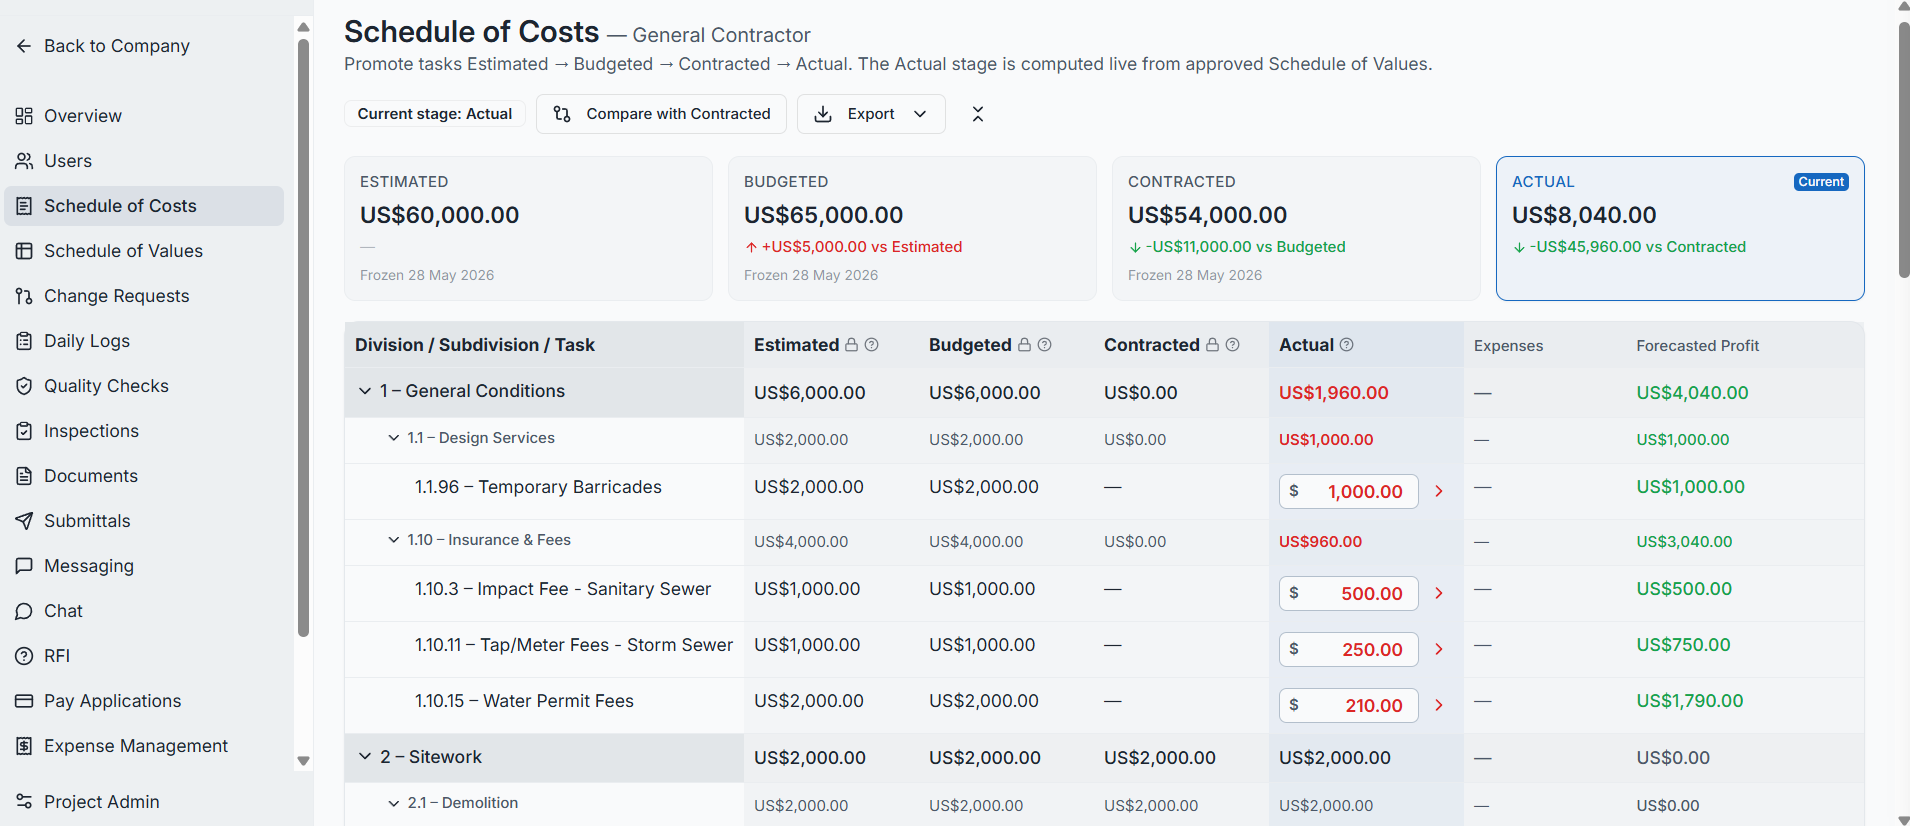
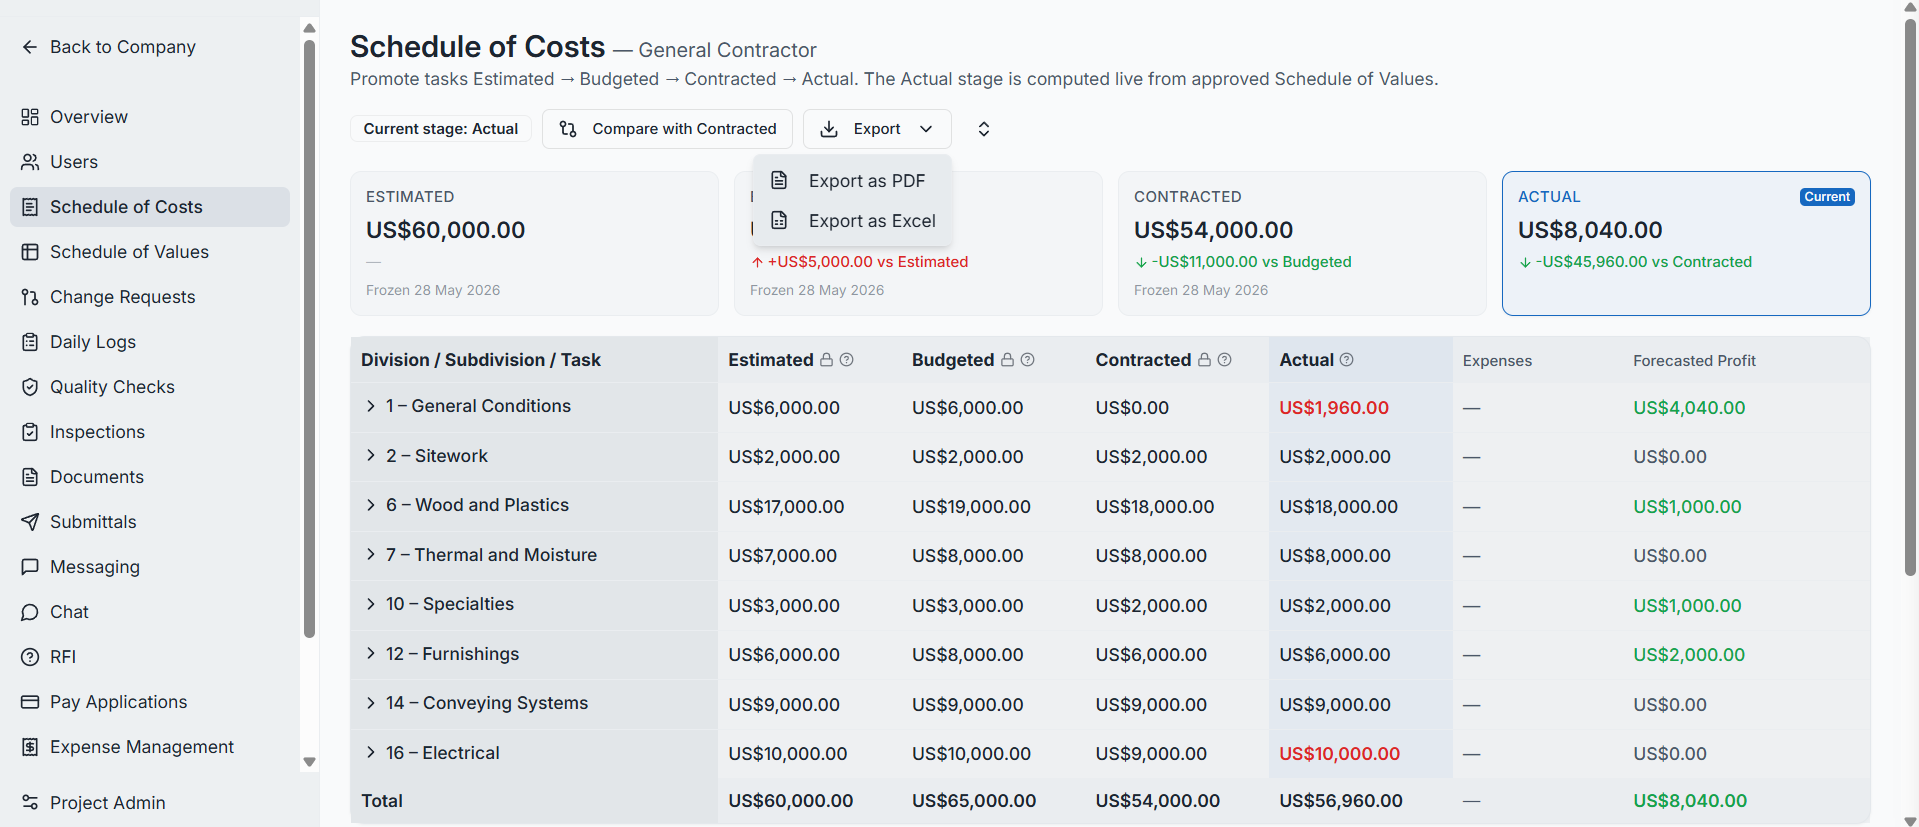
Each stage card at the top of the detail view shows the stage total and the variance vs. the previous stage (e.g., "+$5,000 vs Estimated" or "−$11,000 vs Budgeted").
SOC Table Structure
The detail table follows a three-level hierarchy:
- Division — major work categories (e.g., "1 – General Conditions", "6 – Wood and Plastics")
- Subdivision — subcategories within a division (e.g., "1.1 – Design Services", "6.1 – Rough Carpentry")
- Task — specific line items with cost values at each stage (e.g., "1.1.96 – Temporary Barricades")
Table Columns
| Column | Description |
|---|---|
| Division / Subdivision / Task | Expandable hierarchy of cost line items |
| Estimated 🔒 | Frozen original estimate |
| Budgeted 🔒 | Frozen budget baseline (promoted from Estimated) |
| Contracted 🔒 | Frozen contract value from the linked SOV |
| Actual | Live value computed from approved SOV Pay Applications |
| Expenses | Additional field-level expenses associated with the task |
| Forecasted Profit | Budgeted minus Actual — shown in green (profit) or red (loss) |
Cost Overrun Indicators
The SOC uses visual cues to surface cost risks immediately:
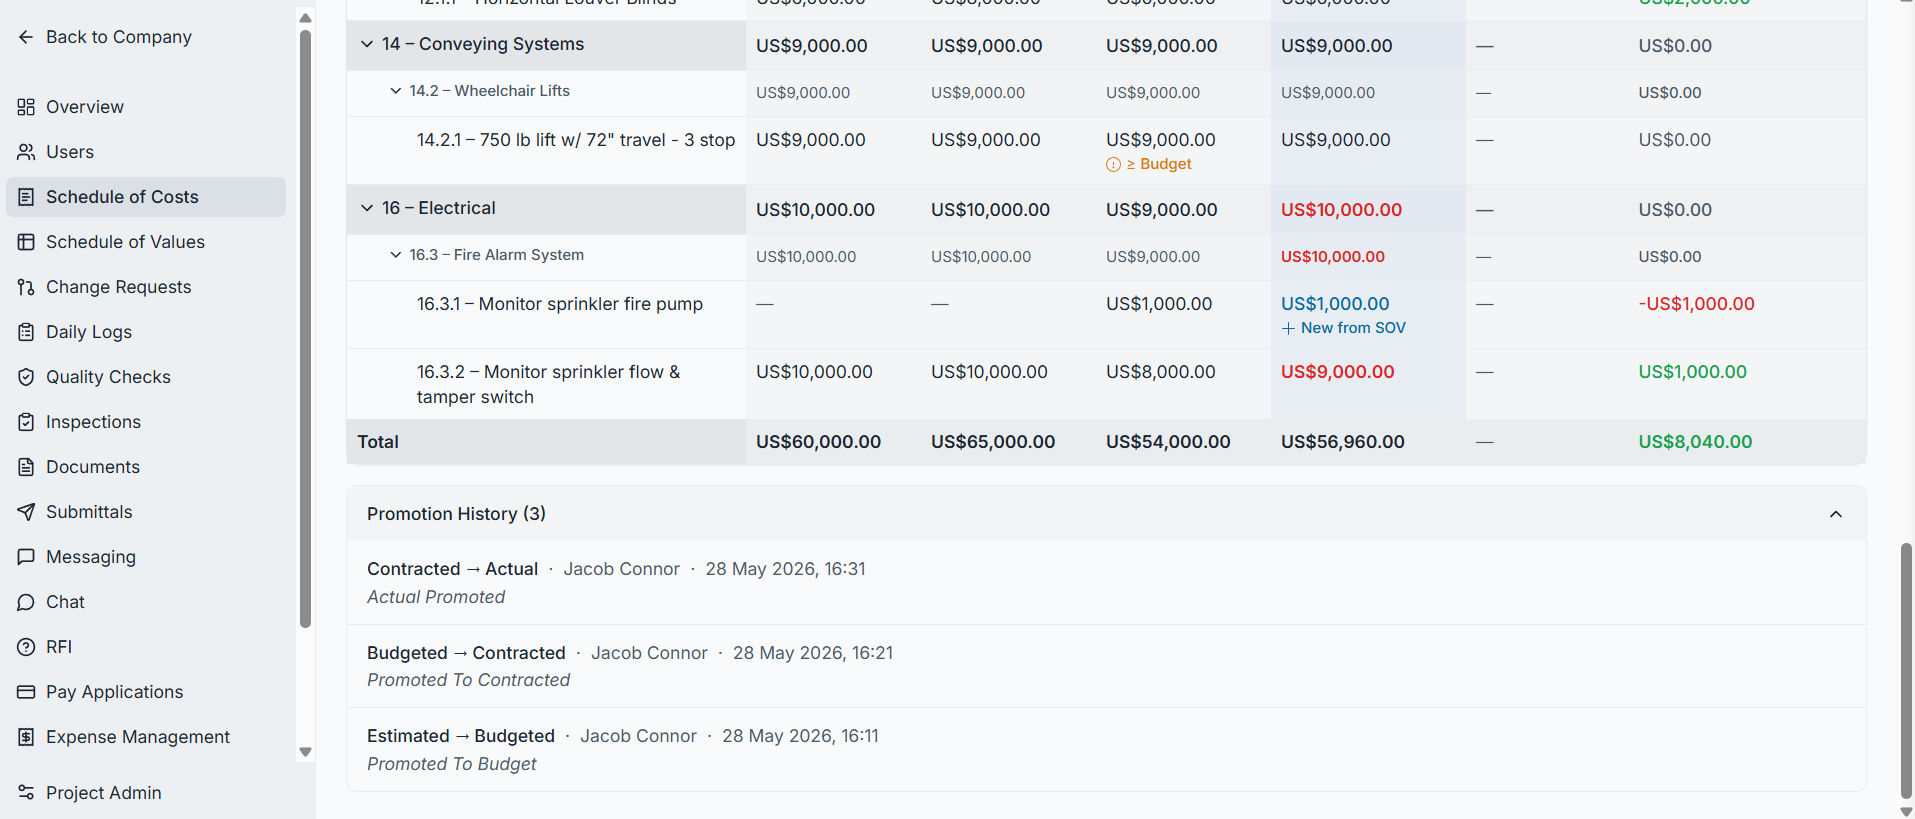
- ⚠ ≥ Budget (orange badge) — appears on the Contracted column when the contracted value equals or exceeds the Budgeted amount, signaling a potential overrun at the contract stage
- Red Actual values — the Actual column turns red when actual costs exceed the Contracted value
- + New from SOV (blue badge) — marks tasks that were added to the SOV but were not in the original SOC estimate, making scope additions easy to spot
Current Stage & Compare View
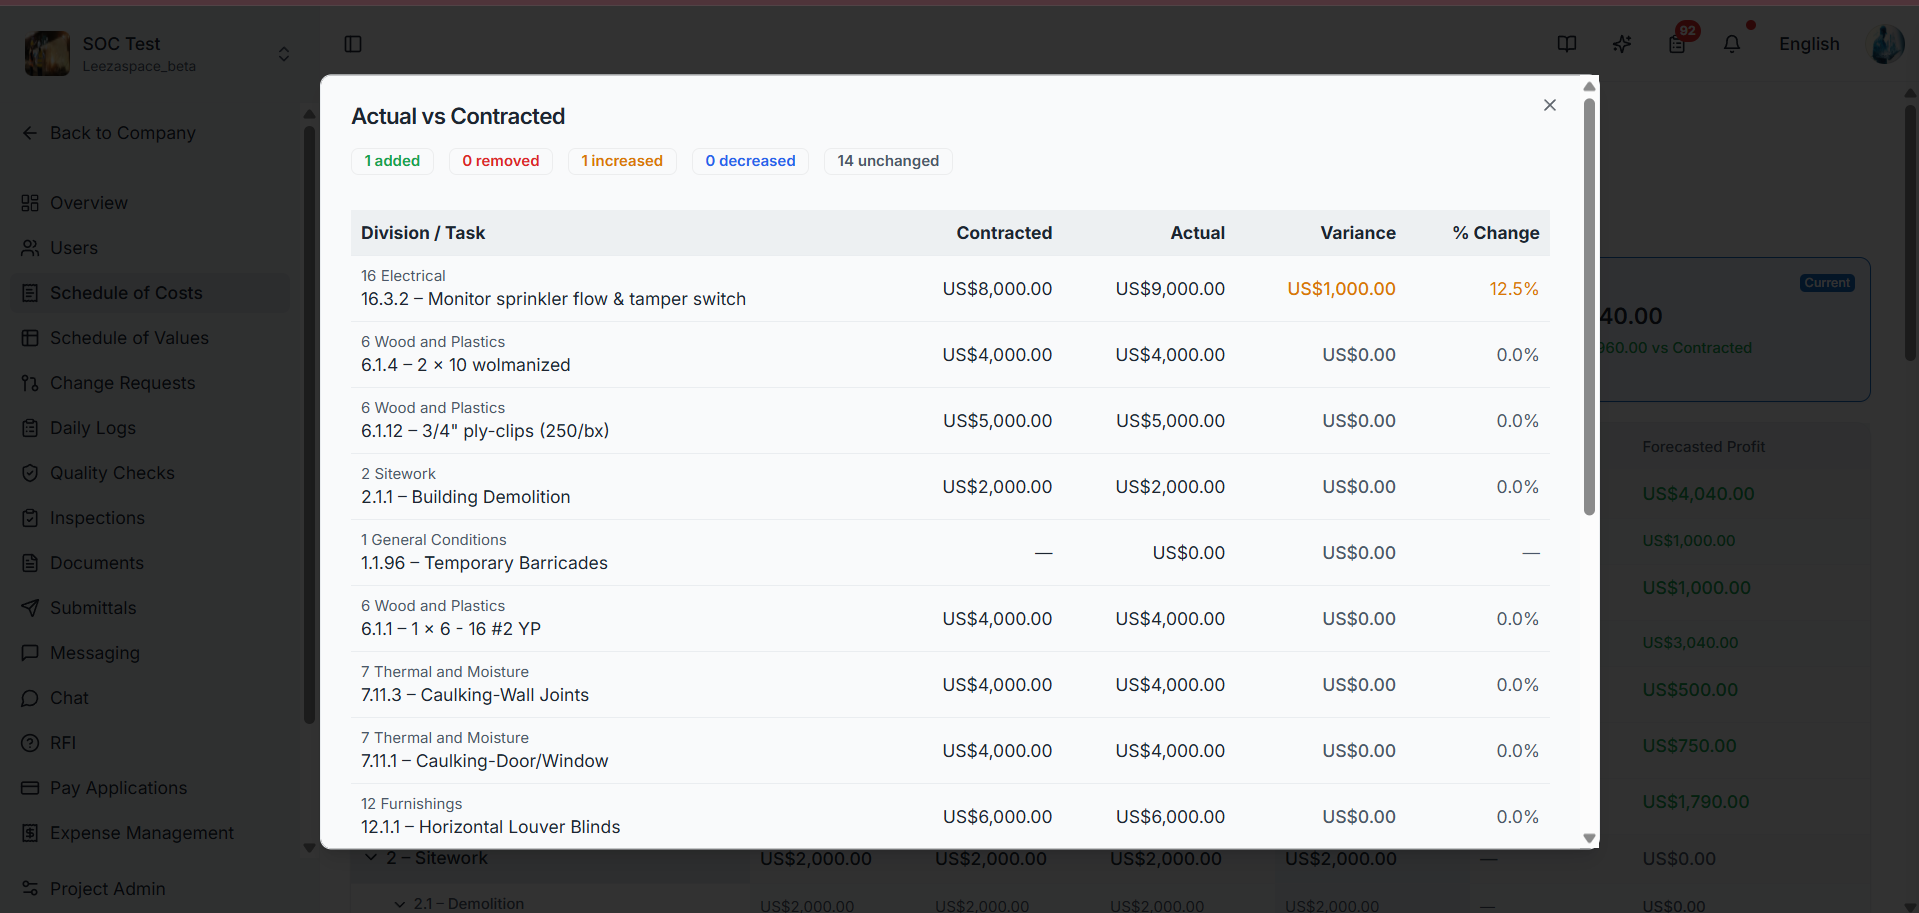
A "Current stage" chip at the top of the page shows which stage the SOC is actively tracking. The "Compare with Contracted" button opens a side-by-side comparison view, letting the team quickly evaluate how the current stage measures up against what was contracted.
Promoting Stages
Tasks are promoted through the four stages as the project progresses:
- Build the Estimated stage — PM or Superintendent adds Divisions, Subdivisions, and Tasks with cost values during the planning phase
- Promote to Budgeted — once the estimate is reviewed and accepted, it is frozen as the official budget baseline
- Contracted stage populates — when the linked SOV is approved, its scheduled values flow in as the Contracted column
- Actual updates live — as Pay Applications are approved against the SOV, the Actual column updates automatically
Schedule of Costs vs. Schedule of Values
| Aspect | Schedule of Costs (SOC) | Schedule of Values (SOV) |
|---|---|---|
| Purpose | Full-lifecycle cost tracking across 4 stages | Formal billing breakdown for Pay Applications |
| Columns | Estimated, Budgeted, Contracted, Actual | Scheduled Value, % Complete, Balance to Finish |
| Created By | General Contractor (PM / Superintendent) | General Contractor |
| Live Data Source | Actual column computed from approved SOVs | Progress updated via Pay Applications |
| Used For | Cost planning, overrun detection, profit forecasting | Monthly billing (G702/G703 format) |
Role Access:
| Role | Access Level |
|---|---|
| General Contractor | Full access — create, edit, promote stages, and manage SOC |
| GC Project Manager | Full access |
| GC Superintendent | Full access |
| Owner / Developer | VIEW — can monitor costs and variances |
| Subcontractor | VIEW only — limited to their assigned cost areas |
| GC Member | VIEW only |
Video Tutorial
Schedule of Cost (SOC) — Module Walkthrough